 orkiva
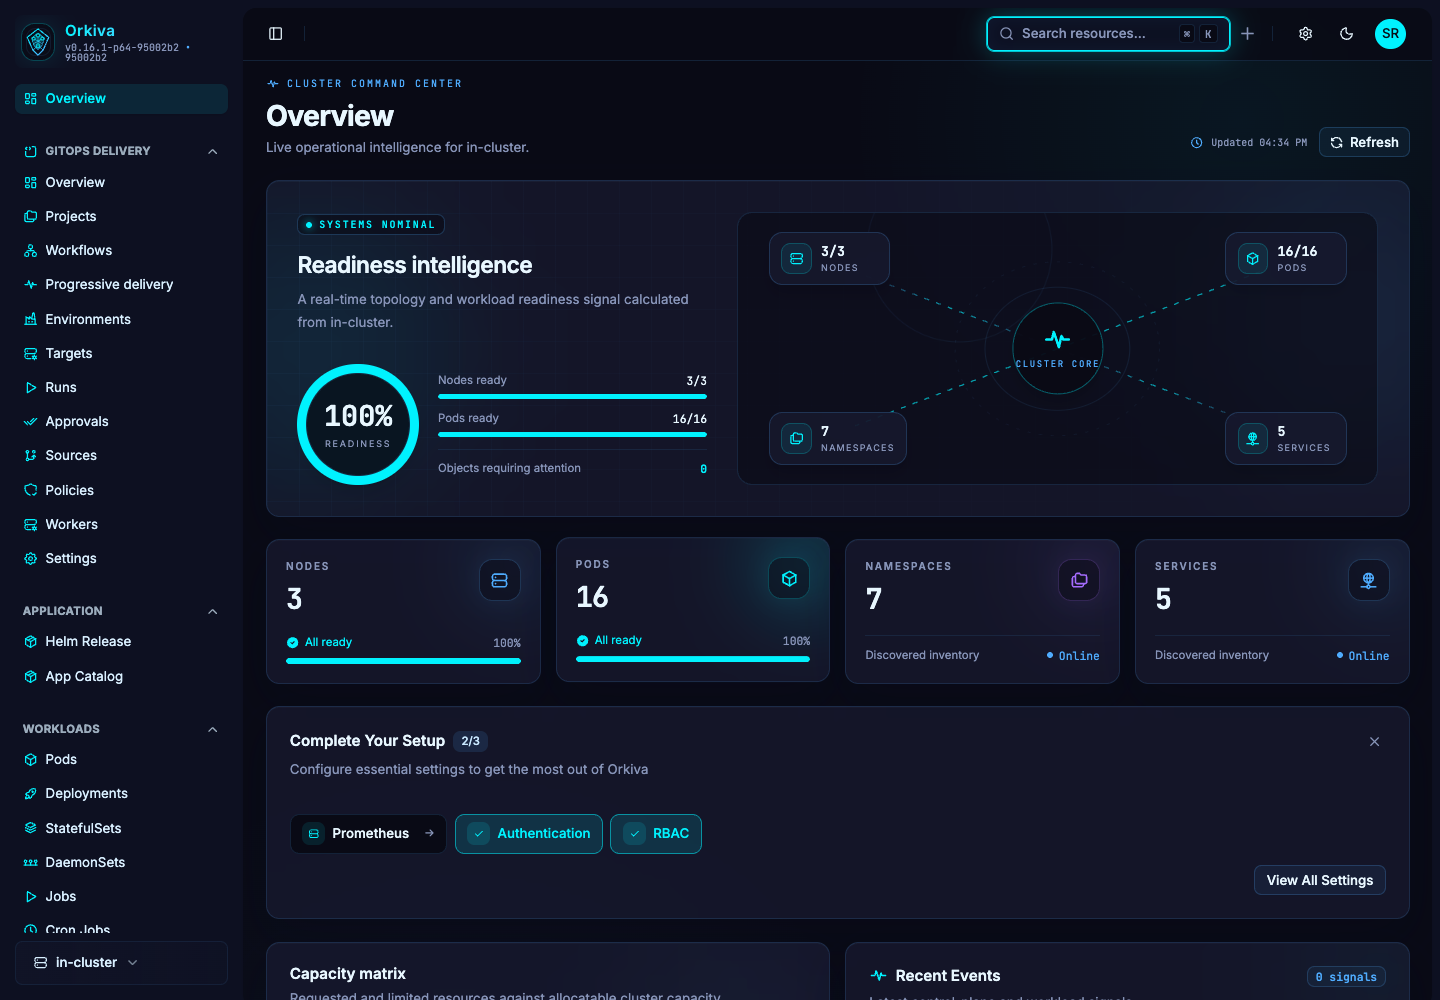
 Read the cluster overview#
- Select the cluster and open Overview.
- Inspect readiness and the node/pod/resource summaries. Open the relevant resource list when a summary suggests a problem.
- Compare desired and ready workload state on the resource detail page rather than treating the overview count alone as a diagnosis.
- Refresh after resolving the issue to see the current observation.
Resource monitoring#
The Monitor tab is available on supported pod, workload and node pages. Use it to inspect the metrics the configured cluster integrations return. Resource readiness is read from Kubernetes; historical charts can depend on Prometheus and metrics availability.
An administrator can set a Prometheus URL on the cluster connection. The backend also contains Prometheus discovery logic. If charts are empty, verify discovery or the configured URL, network reachability from the server, and whether the relevant metric series exist.
Use metrics during an investigation#
- Start with the affected workload and inspect its pods.
- Compare CPU and memory observations with the resource requests and limits in the container configuration.
- Check Events and logs for scheduling, image-pull, health-probe or application errors.
- Use the observation time and chart time range to correlate the symptom. A current healthy state does not prove that an earlier interval was healthy.
Interpretation limits#
A connected cluster can have unavailable metrics. An empty chart is not zero usage, and a successful API request is not application-level health. The console reports the data available from its Kubernetes and metrics connections; it does not automatically create a metrics stack.