 orkiva
 Investigate an action#
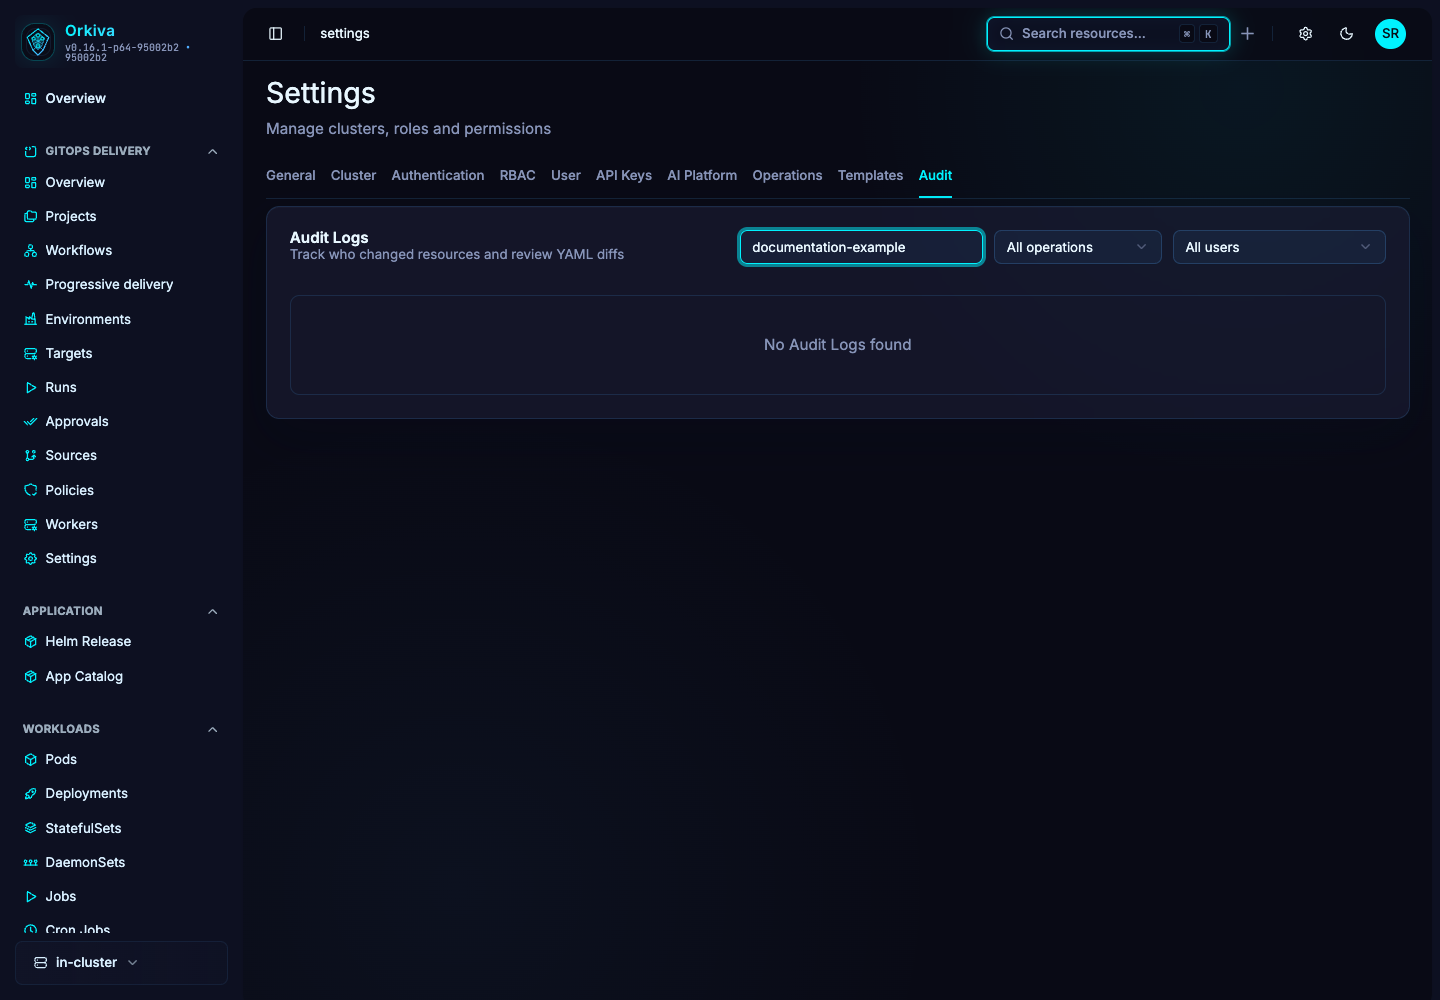
- Open Settings → Audit.
- Narrow the available time, actor, action and resource filters to the event you are investigating.
- Inspect the recorded request/action context and result. Correlate the object, cluster and time with Kubernetes state or the related Delivery run.
- Use pagination to review the surrounding events instead of assuming the first page contains the complete interval.
Separate the different histories#
| Record | What it explains |
|---|---|
| Audit log | Who performed an application action and the recorded outcome/context. |
| Resource history | Recorded changes associated with a resource. |
| Delivery run and events | The sequence, plan, approvals, execution and verification of a delivery attempt. |
| Container logs | Output written by the selected workload container. |
Interpret missing evidence#
An absence in the current filter is not proof that no action happened. Check the scope, filters, pagination and retention settings. An API failure can occur before a Kubernetes change; an interrupted mutation can require investigation of the live resource to establish the final outcome.
Preserve relevant record identifiers and times when opening a support case. Do not paste secrets or entire unreviewed diagnostic archives into a general issue tracker.